1. Introduction
Please note that the following section of this guide has been extracted from the Atkins paper “Seismic Modelling of an AGR Nuclear Reactor Core” (see References and Further Reading for detail).
With the risk from earthquakes being low in Britain, the design of earlier AGR (Advanced Gas-cooled Reactor) nuclear power stations designed during the late 1960’s, did not consider the consequences of seismic loads. More recently, however, it was accepted that the stations could (even though with a very low probability) experience a seismic event of significant severity. Consequently, it became a requirement to demonstrate that these earlier nuclear power stations, of which Hinkley Point B and Hunterston B were the first to start operating, can be safely shut down in the case of a seismic event.
In order to satisfy this requirement, British Energy asked a TSA Supplier (Atkins) to develop a 3-dimensional computer model capable of predicting the seismic responses of typical AGR reactor cores and of assessing their behaviour during an earthquake event, with particular emphasis on evaluating:
Loads on individual keys,
Loads on the elements of the restraint structure,
Patterns of peak brick displacement through each layer,
Double crack separation/shear,
Fuel stringer squeezing force,
Retention of key engagement,
Control rod insertion path alignment during and following the event.
2. Brick Finite Element Model
The finite element model of the core was developed so that it simulated all of the significant interactions between adjacent bricks, and between the bricks and the core restraint structure.
The aim of the work was to investigate the dynamics of the core, but was not to consider stresses caused in the bricks in detail. Because of that, and in order to keep the size of the finite element model manageable, a decision was made to not adopt a 3D model of each brick as a solid body (with ‘brick’ type 3D finite elements) with contact surfaces.
Instead, each brick in the core was modelled as a rigid, vertical body, with inertial and other properties attached to it. In order to represent possible interactions with the adjacent bricks along its height, each rigid body was attributed seven planes in which rigidly connected nodes were to be defined in order to attach spring/dampers to the brick, for modelling contact between adjacent bricks. This is illustrated in Figure 83.
The keying system was designed to allow some free motion before becoming engaged by specifying clearances in the system. In order to model these clearances, the springs modelling the impact behaviour have force displacement curves as depicted in.

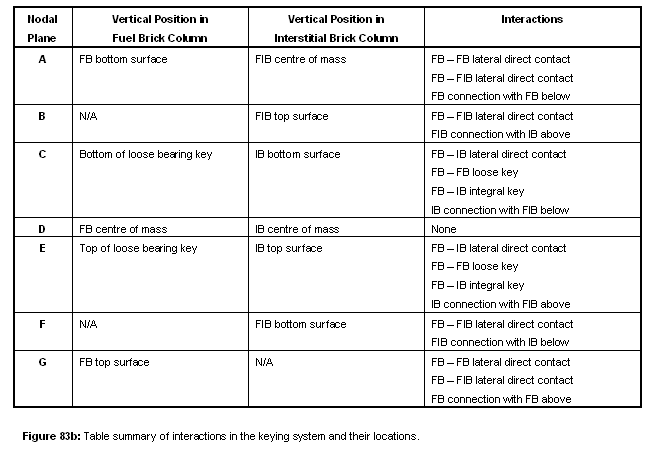
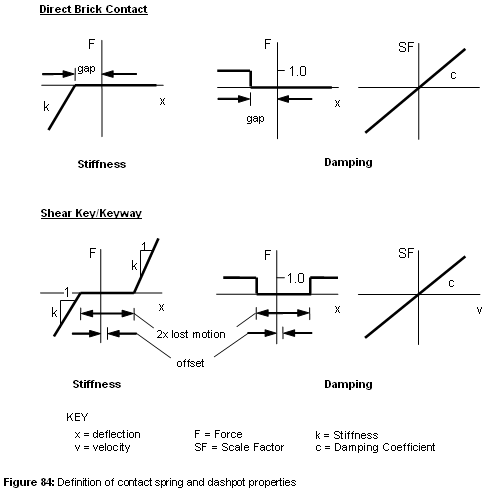
Dimensions of the bricks and keys, as well as clearances in the keying system were calculated based on the geometry of the bricks after a prescribed number of full power years, i.e. the effects of irradiation on dimensions, stiffness and shape of the bricks, keys and keyways were taken into account. The developed model had the capability to account for potential damage induced in bricks due to irradiation, thermal or other defects. For example, development of a single vertical through-the-wall crack would cause opening of the brick’s cross section into a C shaped profile. This would lead to changes in the apparent radius of the brick, as well as offsetting and changed clearances in the shear keyways. If a secondary crack develops, the brick would split vertically into two half bricks. The developed model was designed to be able to simulate these; positions of the cracked bricks and crack plane orientations can be randomly distributed within the core’s more irradiated zones with prescribed probabilities of primary and secondary cracks occurring.
Connections of the bricks within a stack is twofold; horizontally, the keying system at the ends of the bricks only allows limited relative horizontal motion of the bricks; vertically, the ends of the bricks are designed so that the moderator brick above rocks on the brick below (i.e. there is no full area contact). This rocking feature was designed to help evenly distribute stresses due to thermal expansion. For the rocking motion, two dominant rocking directions were designed; higher stiffness for rocking in a core’s tangential direction, and lower stiffness for rocking in the core’s radial direction. These end features were also modelled by nonlinear springs connecting relevant nodes on brick ends,
_Features.PNG)
3. Restraint Structure Finite Element Model
The main components of the restraint structure are depicted in Core Restraint Structure: these comprise of:
Restraint links: one end of the restraint links is spigotted into peripheral bricks at a mid-layer plane whilst the other end is fixed into a restraint beam.
Restraint beams: there are 16 beams per horizontal mid-layer plane, each beam supporting four restraint links.
Two Warwick links per beam, creating a trapeze on plan: the Warwick links are pin jointed at both ends.
One centralizing bracket per restraint beam designed to locate the restraint beam circumferentially in relation to the restraint ring beam: the brackets were designed to allow free relative motions in radial and vertical directions.
The Warwick links are connected into the restraint ring beams, which are connected into the boiler shield wall.
The FE model of the core models the restraint structure up to the boiler shield wall, which is assumed to be rigid and is where the input motion due to the seismic event is applied to the model. Figure 86 shows a finite element model of the restraint structure in more detail. Each restraint beam with its associated restraint links was modelled as a single rigid body. Flexibility of the components and clearances in the system were modelled using direct springs and dampers. The centralising bracket spring properties were developed by considering a separate, more detailed component finite element model incorporating material and geometrical non-linearity. Results from this component model were than transformed into a load-displacement curve for the respective spring.

The main aim of the work was to demonstrate that, during and following the seismic event, the core can be safely shut down and held down. Based on this requirement, the following aspects of the core performance need were assessed for the seismic analysis:
Integrity of the keying system,
Integrity of the core support structure,
Fuel and control channel alignment, i.e. interaction of the channels with the fuel stringers and control / sensor rods to allow free movement of these components and free flow of coolant.
General level of displacement of graphite bricks.
4. Running the Finite Element Model
The analyses were run for an acceleration time history extracted at relevant locations from the calculated responses of an earlier and simplified finite element model of the reactor. A full time history analysis was carried out with a time step set sufficiently short to prevent any instability in results. Sensitivity studies were carried out to investigate the effects of various time-step sizes on the model behaviour. At the beginning of the analyses, the model is left for a certain period of time to settle down into an equilibrium position, before the seismic accelerations are applied. The analysis is run for the whole duration of the assumed seismic event.
Sample results are shown in Figure 87. The actual results and conclusions of the seismic analyses can be found separately in References and Further Reading.

